In this article we will look at:
- units and ranges,
- guidelines,
- lab reference ranges,
- age-related decline and prevalence of low testosterone
- declining testosterone levels over time.
Units and Ranges
Thresholds for Low Testosterone: The term “low testosterone” generally refers to levels that fall below a clinically accepted threshold, typically assessed through measurements of total testosterone.
Total testosterone is widely used due to its routine availability, although free testosterone represents the biologically active portion that enters cells and is often considered more indicative of functional testosterone levels.
Guidelines: Looking at the British Society for Sexual Medicine Guidelines on the assessment and management of testosterone deficiency in adult men, the threshold for low testosterone is 12 nmol/L. The guidelines note that the diagnosis of symptomatic TD requires the presence of characteristic signs and symptoms, plus reduced serum concentrations of total testosterone (TT) or free testosterone (FT). These are widely used guidelines amongst clinicians in the UK treating testosterone. It’s important to note that testosterone deficiency should always be treated in the presence of signs and symptoms.
Lab reference ranges: It should be noted that lab references ranges are provided for guidance in the interpretation of results for clinical decision making. They are conventionally set to give the range of values which would be found in approximately 95% of a statistically ‘Normal’ population. So 2.5% of the time a value will be less than the lower limit of this interval, and 2.5% of the time it will be larger than the upper limit of this interval, whatever the distribution of these values. So in practical terms, a man could be considered within ‘normal ranges’ but fall into the bottom 5% of a healthy population.
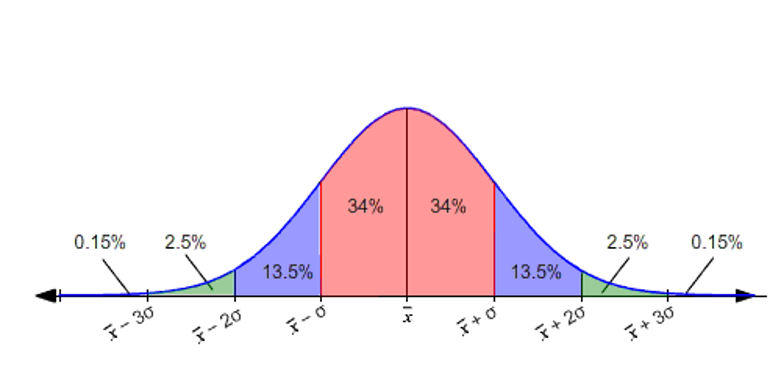
Figure 1: Standard distribution curve. The green areas would flag as abnormal.
Units: In the UK, testosterone levels are measured in nanomoles per liter (nmol/L), while in the US, the preferred unit is nanograms per deciliter (ng/dL). Conversion from nanograms per deciliter (ng/dL) to nanomoles per liter (nmol/L) is nmol/L=ng/dL×0.0347— so approximately a third and moving the decimal place once left (you can see examples of conversions below)
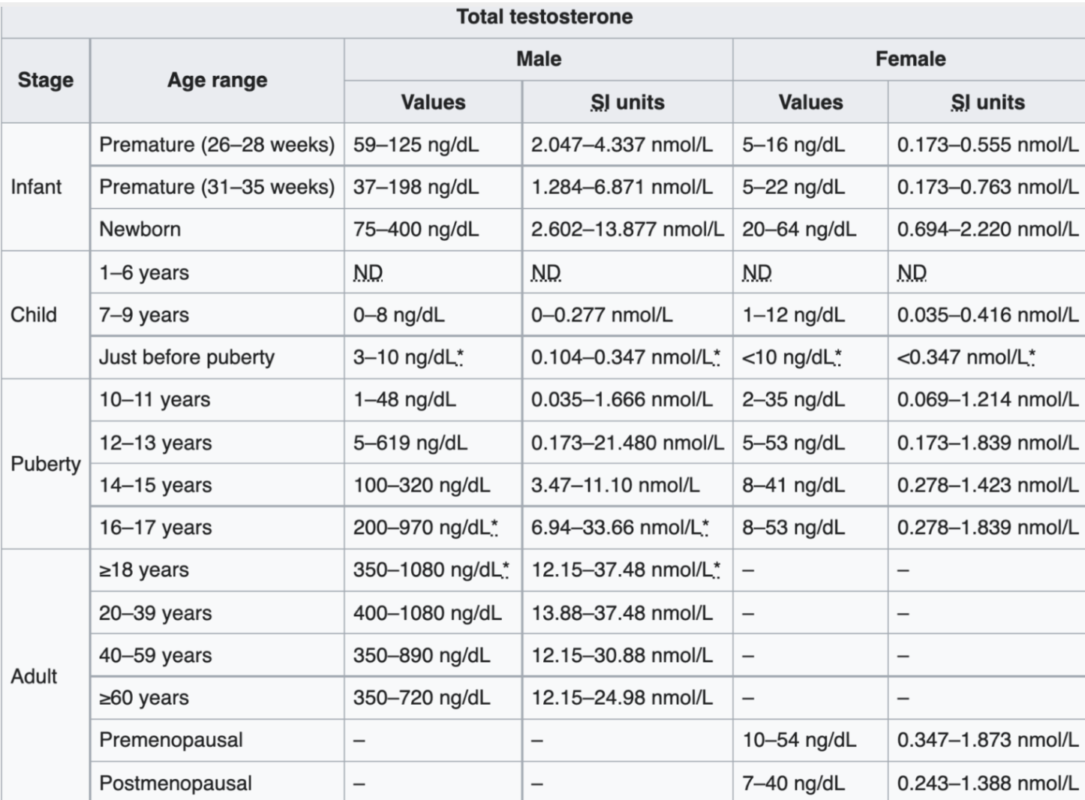
Figure 2 Reference: In Figure 1 (Chernecky and Berger, 2012), total testosterone levels are presented across various age groups for both males and females, originally measured in ng/dL but converted here to nmol/L. This table demonstrates the broad range of testosterone levels from infancy to adulthood:
- Newborns: Testosterone levels range from 2.6 to 13.9 nmol/L. Such levels are within ranges observed in some adult males, although they decrease sharply within the first years of life.
- Childhood to Pre-Adolescence: Testosterone levels remain low and often undetectable.
- Puberty and Adolescence: Testosterone levels begin to increase at around 10-11 years and rise substantially during puberty (ages 12-14).
- Peak Levels: The highest testosterone levels are observed in late adolescence through young adulthood (teens to 30s).
Testosterone Levels in Adults: For young adult males (20-39 years), the typical range can extend from 13.9 to 37.5 nmol/L. This broad range represents a distribution from the 10th to the 90th percentile, meaning 10% of men may be below or above this threshold depending on individual physiology and lab differences. This variability across laboratories can result in minor discrepancies in reported levels.
Testosterone in Females: Midlife females before menopause generally show testosterone levels in the range of 1.7 to 3.5 nmol/L, roughly one-tenth that of the average male level at a similar age.
Free Testosterone as a Key Indicator
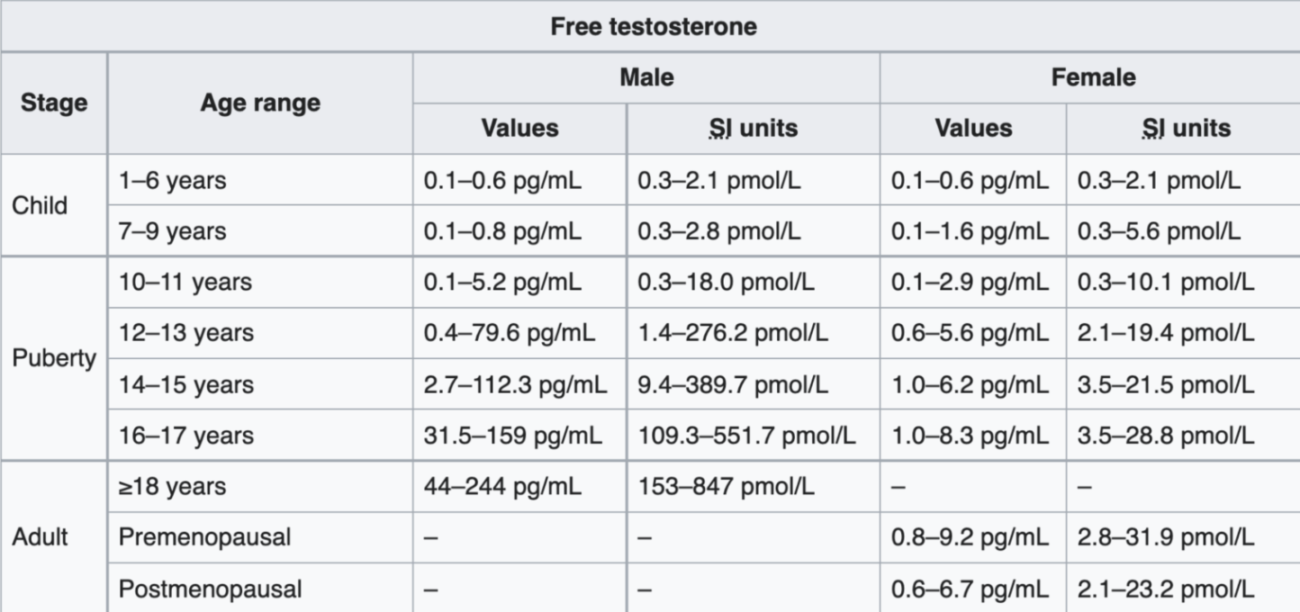
Figure 3 Reference: Figure 3 (Chernecky and Berger, 2012) outlines free testosterone levels for males and females (expressed in pico grams per Litre) For adult males, free testosterone ranges from approximately 0.15 to 0.85 nmol/L (as . The broad range highlights individual variation, with around 80% of men’s free testosterone levels falling within this range, in contrast to the more constrained ranges seen in other blood markers like potassium or hemoglobin.
Important note: Measuring free testosterone directly is possible, but it’s challenging and not widely available. So it’s often calculated instead, using total testosterone, SHBG, and albumin levels. It’s a complicated equation that produces a very reliable estimate. As we have noted before in this article series, free testosterone is unbound from SHBG and albumin.
Clinical Implications of Free Testosterone Range: The large range for free testosterone suggests other factors, such as androgen receptor sensitivity and genetic variations, may contribute to individual differences in physiological responses to testosterone. Unlike more stable biomarkers (e.g., hemoglobin), which vary minimally between healthy individuals, free testosterone’s variability means that individuals with levels at the lower end of this range (e.g., 0.15 nmol/L) may experience different symptoms and functional states compared to those at the higher end.
Age-Related Decline and Prevalence of Low Testosterone
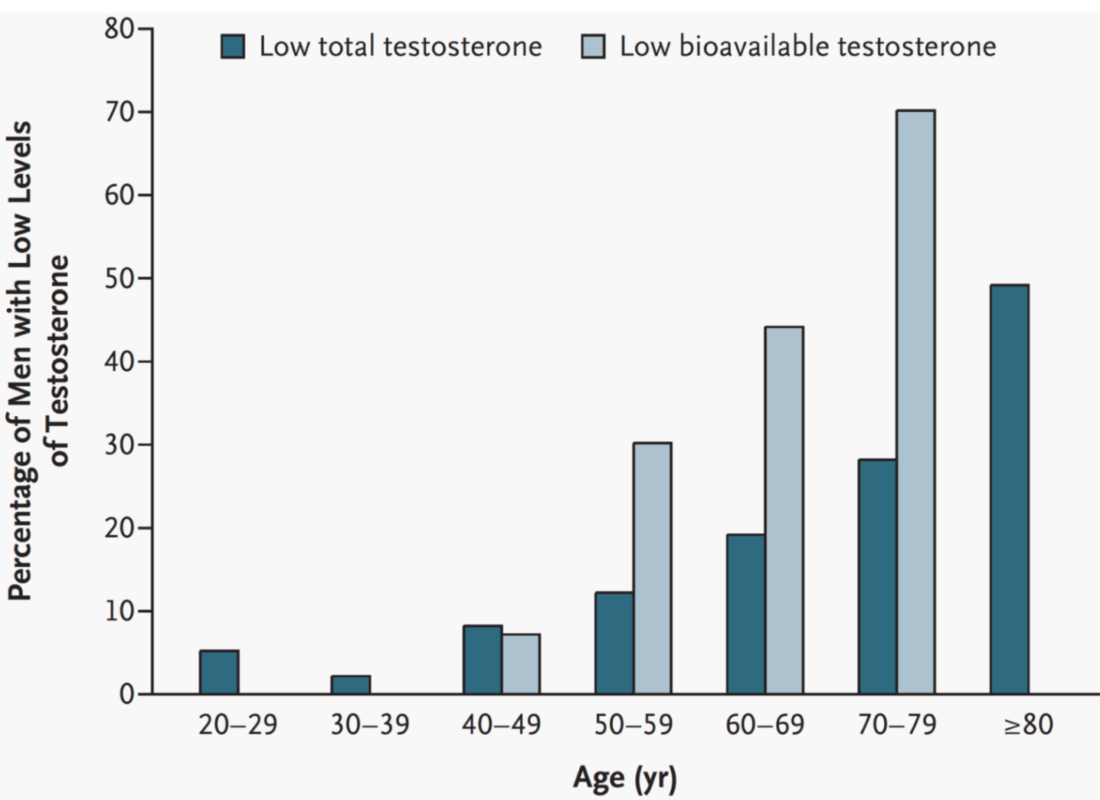
Figure 4 Reference: Figure 4 (Rhoden and Morgentaler, 2004) illustrates the prevalence of low testosterone as men age. Total testosterone levels below 11.3 nmol/L (325 ng/dL) are often flagged as low, a threshold many clinicians consider very low. Bioavailable testosterone (a combination of free and albumin-bound testosterone) is also measured, with levels under 2.43 nmol/L (70 ng/dL) considered low. This prevalence increases notably with age:
- 20s: Only 5% of men fall below the low testosterone threshold.
- 30s: Approximately 2-3% have low testosterone.
- 40s and beyond: The prevalence gradually rises, reaching 10% in the 40s and 12-13% in the 50s.
- 80s: Around 50% of men in their 80s have low testosterone by total level metrics, while bioavailable levels show even higher prevalence, with about 70% of men affected by their 70s and 30% by their 50s.
More recent studies have reported even bigger increases of a drop in total testosterone across ages, as we are seeing declining testosterone levels year on year in men of the same age. This study described the prevalence of testosterone deficiency, defined as levels below 300 ng/dL (10.4 nmol/L), was 30.8% across the entire sample. By age group, prevalence rates were 22.6% among young men, 35.8% among middle-aged men, and 34.6% among older men.
Problems with lab reference ranges:
It is noted within the medical literature that there is geographical, age and environmental differences in some populations used for the reference ranges. These issues are noted within the medical spheres of endocrinology and urology. For example in a study 120 laboratories in 47 states in America it was found that ‘ranges are predominantly defined by limited population studies of men with unknown medical and reproductive histories’. In other terms this means you do not know who was used to create the references ranges and any underlying medical problems they may have had. The list of endocrine disruptors is endless. So we cannot assume that lab reference ranges are normal. You could even argue that, based on the prevalence of obesity and sedentary lifestyles, that the reference ranges are based on unhealthy populations.
These discrepancies can also been seen in NHS ranges as note here, that the ranges are ‘locally determined: deemed still representative of current patient population’ but ‘under review by clinical scientist team as a quality improvement action’. Some NHS trusts report low thresholds as far as 6 or 8 nmol/l for adult males which are well below the lower ranges used in many guidelines.
It is also important to consider that testosterone levels are falling in healthy populations. The reasons for this can be discussed in later blog posts. As discussed, testosterone has large ranges and is not a static physiological marker that is tightly regulated in the body like electrolytes. This raises the question on the reliability of the most up to date references ranges as healthy— are low normal ranges actually ‘normal’?
Declining testosterone levels over time
This study showed that testosterone deficiency has a prevalence of 20% among adolescent and young adult males. We can see this trend in decreasing levels over time. While previous research indicates a general decline in total testosterone (TT) levels across the population compared to previous decades. An elevated body mass index (BMI) correlated with lower TT levels, yet the downward trend in TT remained significant even among men with normal BMI.
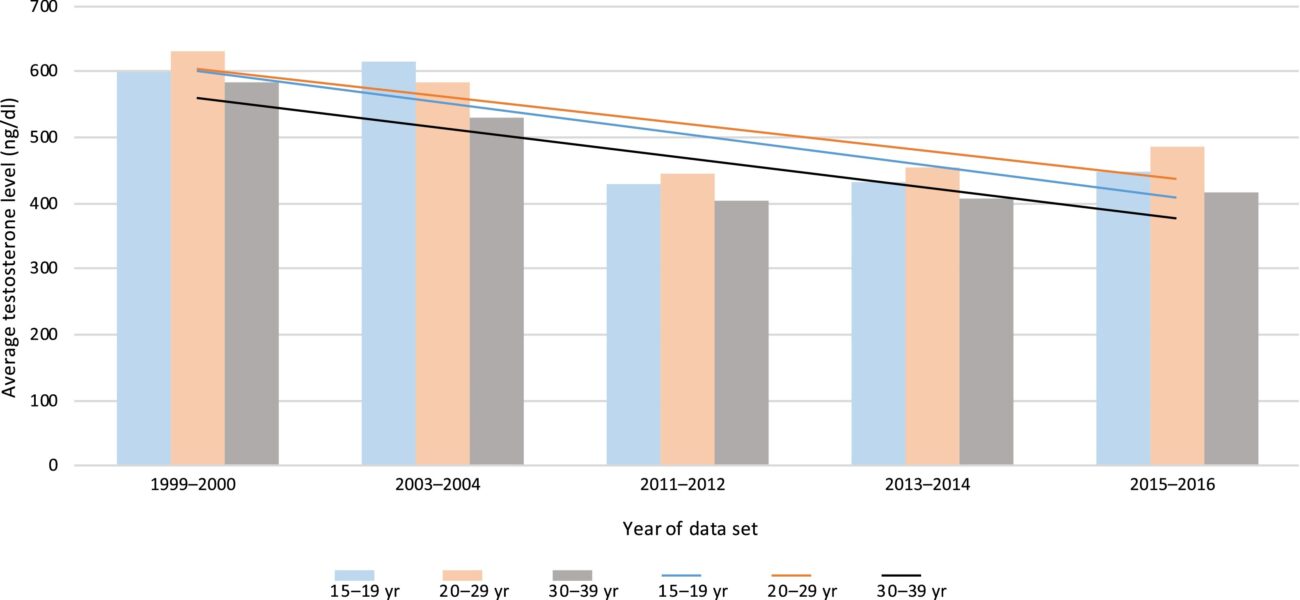
Figure 5: Above (Lokeshwar and Soum D. et al, 2021) we can see almost a whopping 15o ng/dL (5.2 nmol/L)decrease in average testosterone levels across groups of young men. As mentioned this downward trend continued even in men with a normal BMI.
There are several key takeaways from this article:
- Low testosterone should be treated in the presence of symptoms.
- Lab reference ranges can vary significantly. Due to the huge variability in testosterone levels amongst populations used to calculate lab reference ranges, one cannot assume the lower thresholds of lab reference ranges are always applicable.
- Free testosterone is a more important metric as it is biologically active.
- Testosterone deficiency increases with age.
- Testosterone levels are declining over time even in young men with a healthy BMI. This trend is accelerating rapidly.

